The California Recall and Antivax Republicans
County-level voting behavior, COVID cases, and vaccination rates correlate too much to be a coincidence
This entry in Nicholas Grossman’s newsletter is open to all. To get full access to all posts, subscribe.
Pundits will read too much into Democratic California governor Gavin Newsom easily defeating a recall attempt on September 14, making sweeping declarations about what it means for national politics. The real answer is not much. Special elections at unusual times aren’t good predictors of regularly-scheduled congressional or presidential elections. And the preliminary results (63.7 percent against recall, with over 3/4 counted) are similar to the original election Newsom won in 2018, when he got 61.9 percent.
But these results do tell us something about partisan politics and the current state of the COVID-19 pandemic. Look at this, from California pediatrician Eric Ball:
On the left is the recall vote, with the blue-colored counties voting yes (i.e., to remove Newsom) and the red-colored counties voting to keep the governor in office. On the right is current COVID case counts per 100,000 residents, with darker colors indicating more. The maps aren’t identical, but the overlap is evident.
But which way does the causal arrow point?
One possibility is some areas have been randomly hit hard by COVID, blamed the governor, and voted against him. (Whether it’s objectively his fault doesn’t matter here; voters typically treat referendums as “are you happy with the current state of things?”) In that case, COVID levels caused recall vote choice.
Another possibility is that COVID cases aren’t random, but reflect politicized responses to the pandemic. Places with a lot of Republicans were always going to vote against a Democratic governor, and those places are also more likely to have more COVID. In that case, party ID caused both recall vote choice and COVID levels.
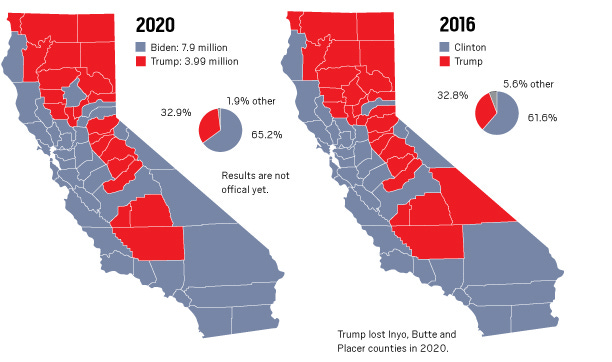
To determine which causal explanation is more likely, consider this county-level map of the last two presidential elections from the California-based Press-Enterprise:
2016 and 2020 presidential results do not perfectly match the 2021 recall vote and COVID case map, and one shouldn’t overstate the connection. There’s some randomness in COVID spread, Joe Biden did better than Hillary Clinton, and governor recalls are not presidential elections. County-level data smooths over some variation, especially since some of these counties have millions of people.
But it’s hard see how much these maps overlap, observe loud opposition to vaccines, masks, and other COVID-fighting measures among conservative media figures, Republican politicians, and angry right-wing activists at school board meetings, and conclude they’re totally unrelated.
As healthcare data analyst Charles Gaba shows, vaccination rate in the United States correlates with 2020 Trump vote down to the county level. That pattern holds in California, as well as other states. The more a county voted for Trump, the less vaccinated it is.
Millions of Republicans are vaccinated, and the unvaccinated population includes many non-Republicans. For example, there’s an “all-natural” version of antivax sentiment popular in some “wellness” communities (including in blue areas of California). Millions of Americans don’t vote or pay attention to politics, so any opposition to vaccines from that subpopulation is unrelated to partisan identity.
But the evidence from California indicates that, for a variety of reasons, being Republican makes an American more likely to oppose to COVID-mitigating measures, and therefore more likely to face waves of the virus months after vaccines became easily available to everyone over 12 years old.
These shots are, by far, the best way to reduce the risk of COVID, and masking also helps reduce spread. Politicized Republican opposition to those measures is unnecessarily prolonging the pandemic.


